
The short version
- Engagement rate tells you how much reaction a creator gets. It cannot tell you whether that reaction is real, or from people who matter to you.
- Benchmark against the tier, not an industry average: roughly 5 to 10% for nano, 3 to 6% micro, 1 to 3% macro, under 1% for mega.
- The same 4.8% can be an excellent creator or a pod. Read it next to audience credibility rather than on its own.
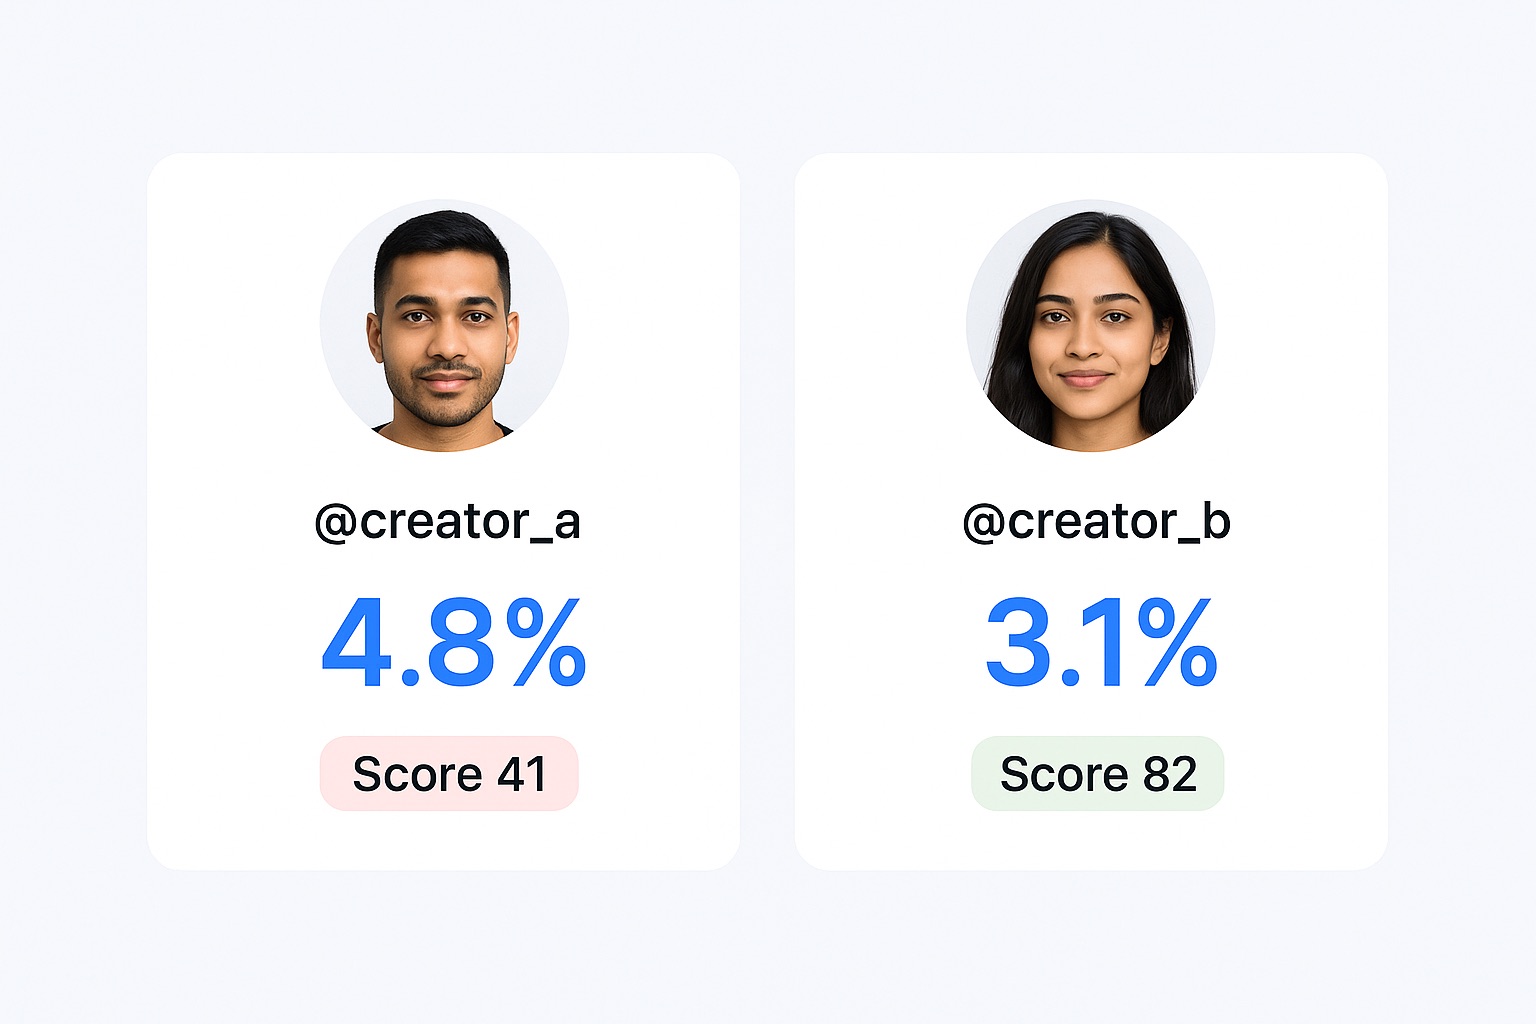
The shortlist came down to two. Creator A: 55,000 followers, 4.8% engagement. Creator B: 52,000 followers, 3.1%. A was the obvious pick and the booking went in.
Three weeks later A’s campaign content had 2,600 interactions. B, who was never booked, posted organically about a competitor’s product the same week and got 1,900 from a smaller following, with comments from people asking where to buy. The engagement rates had been read as a ranking when they were only ever a measurement. Here is how to calculate the number, what good looks like by tier, and when the number is lying.
How to calculate it
Two versions, and they answer slightly different questions.
Follower-based: total engagements divided by followers, times 100. This is the common one because followers are always visible, and it is the version most benchmarks refer to.
Reach-based: total engagements divided by reach, the unique accounts that actually saw the post, times 100. More accurate, since it measures response against who was actually shown the content, but it needs data only the creator or the brand partnership can supply.
Platforms also count differently, which makes cross-platform comparison misleading unless you account for it. Instagram includes saves, since a save signals the content was worth returning to. YouTube works from likes, comments and shares against views. TikTok includes saves against views too, which is part of why its rates read higher than Instagram’s.
What good looks like by tier
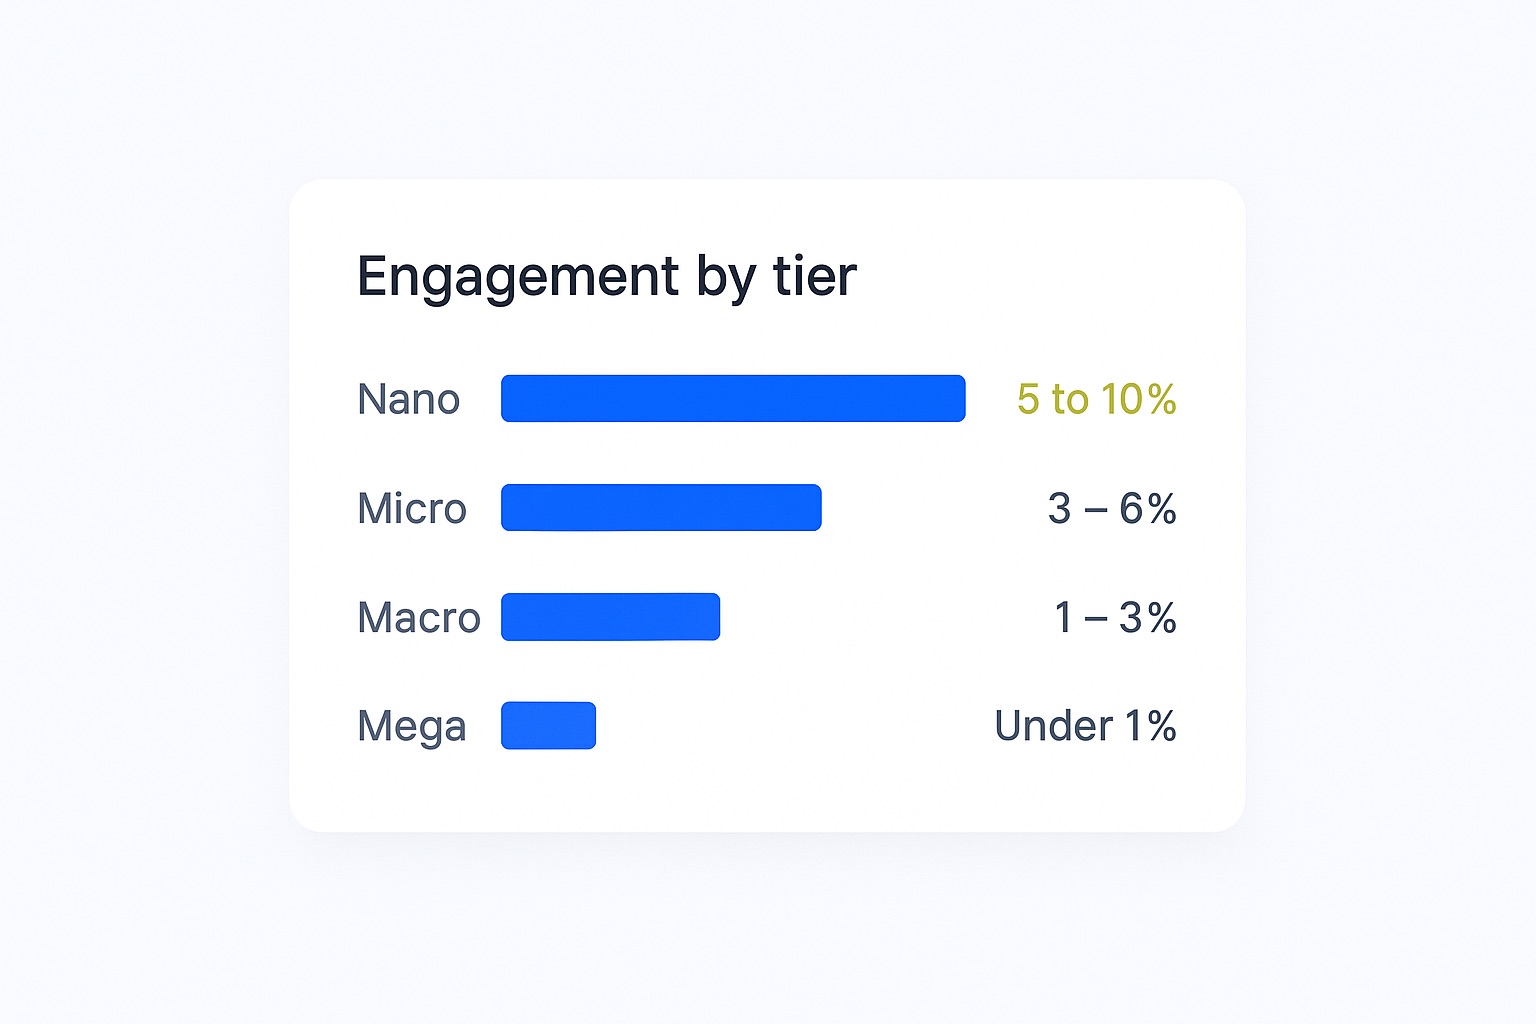
Engagement rate falls as audience grows, so a single benchmark across all creators is not useful:
- Nano, 1,000 to 10,000 followers. Roughly 5 to 10%. Small, close audiences with the highest comment quality.
- Micro, 10,000 to 100,000. Roughly 3 to 6%. The band most campaigns are built on.
- Macro, 100,000 to 1M. Roughly 1 to 3%. Reach starts to be the reason you book them.
- Mega, 1M+. Often below 1%, which is normal rather than a warning sign at that size.
Use the median across recent posts, not the average. One post that travelled will lift an average enough to create an expectation the creator cannot repeat, and you will have priced against it.
When the number is lying
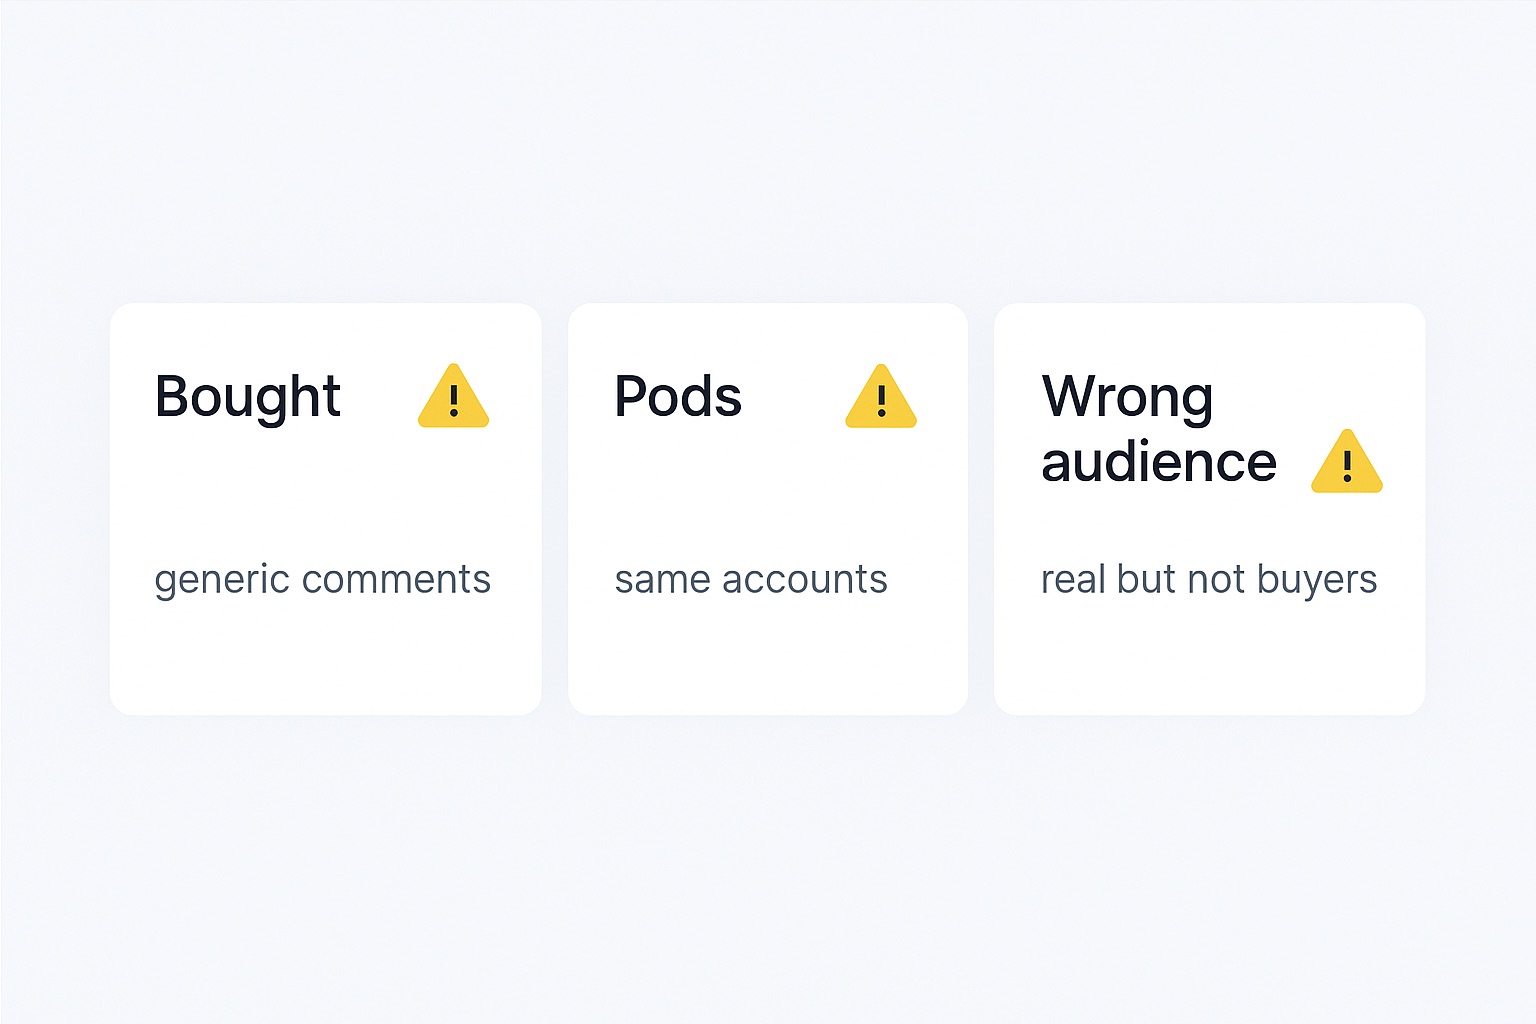
Three situations produce a healthy-looking rate with nothing behind it.
Purchased engagement. Bought likes and comments raise the numerator while the denominator stays put, so the rate improves and the campaign does not. Generic comments and a follower chart with unexplained jumps usually give it away.
Engagement pods. Coordinated groups liking and commenting on each other’s posts at publication. The signature is a spike inside the first hour, the same handles recurring across posts, and comments that could belong under anything.
The wrong audience. The most common and least suspicious case. Engagement is completely genuine, it just comes from people who will never buy, because they are in the wrong country or the wrong life stage. Nothing about the rate itself reveals this.
See CultureX in action
See engagement rate next to real follower percentage, audience location and Social Score, so a strong number can be trusted before you book.
Reading it next to Social Score
Engagement rate is a single measurement taken at a moment. Social Score is a composite built from audience credibility, engagement rate, follower growth, follow ratio and posting consistency, which makes it harder to move with one viral post or a purchased spike.
Used together they give a practical shortlisting rule. Engagement rate in the healthy band for the tier, plus a Social Score that holds up, plus audience location matching your market. A creator who clears all three is a genuinely strong candidate. A creator with an excellent rate and a weak score is the case that started this post.
Sense-checking a rate before you trust it
Any one of these is reason enough to look past the headline figure before booking:
- Comments are mostly emoji or single words.
- Likes are high and comments are almost absent.
- Engagement spikes within the hour, then stops.
- The follower chart has jumps nothing explains.
- Story views are tiny relative to follower count.
- Audience location does not match the market you sell into.
For the full credibility workflow, see follower analysis. For finding creators whose audience fits in the first place, niche fit.
Frequently asked questions
How do you calculate engagement rate on Instagram?
Add likes, comments, shares and saves on a post, divide by follower count, multiply by 100. Do it across the last ten to twelve posts and take the median rather than the average.
What is a good engagement rate?
Judged against the tier: about 5 to 10% for nano, 3 to 6% micro, 1 to 3% macro, and often under 1% for mega. A mega creator at 0.8% is performing normally, not badly.
Why do two creators with the same rate perform differently?
Because the rate counts reactions without saying who produced them. Same percentage, different audiences: one is people who buy your category in your cities, the other is not, and only audience data distinguishes them.
How do I know if engagement is fake?
Look for generic comments, likes without comments, spikes in the first hour that flatten, unexplained follower jumps, and story views far below what the follower count implies. Any one of those is worth a closer look.
Should I use follower-based or reach-based?
Follower-based for comparing creators before a campaign, since it is the only one you can calculate consistently from outside. Reach-based afterwards, when you have the actual reach data, because it measures response against who genuinely saw the post.